Introduction
First of all, what are SCOM modules in general, and managed modules in particular? A module is the smallest building block of any monitor, rule, or discovery. Like composition of atoms create molecules and matter, composition of modules create monitors, rules, discoveries, or other composite modules. Like the ancient meaning of the word “atomos”, modules are “uncuttable” and cannot be divided in smaller parts. Despite modules inside may contain hundreds and thousands lines of code (almost like atoms contain protons, neutrons, and electrons), from SCOM workflow construction perspective they cannot be broken down to parts.
A module on its own is a black box, which has either input or output, or both. Module can receive some data packets, called data items, on its input, or send data items through its output. A module can perform some actions upon data item receipt, or produce new data items upon its internal mechanics, or do some data transform between input and output. The actual possibilities are almost endless, so let’s make it by example.
Building blocks
Let’s have a look at a typical SCOM monitor. What modules are used to create it? The very first module we meet is a timer module, or, how it’s called in SCOM, a scheduler. Most of monitoring subjects require polling, i.e. they cannot produce a push event, or a callback, and so their operational parameters (such as disk usage, CPU queue length, etc.) need to be queried time to time. The standard scheduler module can be configured to run from every second to once a day (plus additional day-of-week features). The scheduler module don’t have input, but output. Such modules called Data Source. The scheduler data source module sends an empty data items to its output every X seconds (depending on its configuration).
The next typical module is a script probe. This module has an input, and an output, and it’s configured with a script body. The module waits for a data item on its input, runs the script, then sends script result to the output. Such module is called Probe Action.
The third typical module in a monitor is a module called Condition Detection. This module also has an input and an output, and it’s usually configured with one or more threshold values. This module waits for an input data item, compare it to the configured threshold values, and then either drop the input item if conditions are not met, or passes it through if the conditions are met.
And the final typical module is usually a module called Write Action. Write Action module has only input. When Write Action receives an input data item, it performs an action. For example, it can create an alert, or resolve it.
The whole typical chain looks like:
| Timer (Data Source) |
| Probe (Probe Action) |
| Condition (Condition Detection) |
| Reaction (Write Action) |
Now, when a new module needs to be created? While authoring new monitors, rules, or discoveries, it’s recommended to reuse the existing standard modules, or combine existing modules to create a new composite module. Reasons to create new module can be:
- There is no such standard module (of cause).
- Standard modules provide very poor performance and/or high impact to monitored system (monitoring system is support system, not the main one, thus its impact must be minimized).
- It’s required to keep module state during module lifespan cycle (will be explained later).
Practical example
Say, we have a requirement to make a monitor, which looks into a database table, where remote sensors write their reading. When a new reading is posted, SCOM should analyze it against a threshold and trigger an alert if it’s over. So, a new Data Source module is required to watch into the table, and output a data items with the last written sample. Then we’ll need a standard Condition Detection to compare the sample against a threshold, and the standard alert triggering mechanism. No problems are here, except no such data source module exists.
However, it’s not an issue. At first glance, the required data source module can be created as a composition of Scheduler data source and PowerShell script probe action. And it will work for sure, but there is a catch. First of all, the enable the required almost-real-time experience, the probe shall run as often as possible, say every 20 seconds. Let’s see that’s happening when the combination of scheduler and PowerShell script do their job: scheduler triggers, PowerShell environment loads, the script connects to SQL server, authenticate, reads top records, returns any new records, disconnects from SQL server, PowerShell environment unloads, data items is ready for further processing.
The problem here is that PS load/unload, SQL connection and authentication are heavy cost operations. It might be OK if we read just one sensor data, but when it comes to tens or hundreds, the monitoring will become counterproductive: instead of doing monitoring with minimum impact, it will take all resources for backup job (i.e. PS load/unload), not actually doing the main task.
So here managed modules come to help.
When a new module is presented to SCOM, there are three module implementation types available: composite (as shown above), native, and managed. Don’t be confused with module types, which are Data Source, Probe Action, Write Action, and Condition Detection. While composite modules are just a combination of existing modules, native module can only be developed by Microsoft, managed modules development is available to all SCOM authoring developers.
In fact, a managed module is a .Net class, which must meet few requirements, like inherit from particular base class and implement few compulsory methods, as well as make few calls to the core SCOM Agent engine. It can be written in any .Net language, but usually C# is used.
Given this practical example, let’s start investigating managed module life cycle. Official details about managed modules development can be found at https://docs.microsoft.com/en-us/previous-versions/system-center/developer/hh769912(v=msdn.10). While this sounds quite complicated, a simplest managed module can be created to show basic mechanics.
Managed Modules Lifecycle Research
Tools
What is needed for this project.
- Microsoft Visual Studio 2017 (https://visualstudio.microsoft.com/). Any edition should work, except Code.
- System Center Visual Studio Authoring Extensions (https://www.microsoft.com/en-nz/download/details.aspx?id=30169)
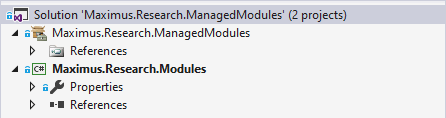
Creating solution.
A new solution with two projects need to be created for this research. First project is a .Net Framework class library. When creating a project Visual Studio will ask about .Net Framework version. This will depend on SCOM version and monitored OS. .Net 3.5 is the minimum valid version providing wider compatibility with old OS versions, but it misses latest security improvements. I’d recommend to use 4.6.2 or higher.
Next project to add is Operations Manager Management Pack. For this example I selected SCOM 2012 R2 for better compatibility.
NB! Project source code can be found at https://github.com/MaxxVolk/Maximus.Research.ManagedModules.
Signing the project. A management pack should be signed and sealed to be able to contain certain elements such class definitions. While there is no such requirement right now, I’ll add sealing to the MP project. Similar for a class library. There is no strict requirement to strong name it, but without signing management module assembly, SCOM Agent will need restart to load an updated version of existing assemble. So, if management pack changes often, strong naming is recommended.


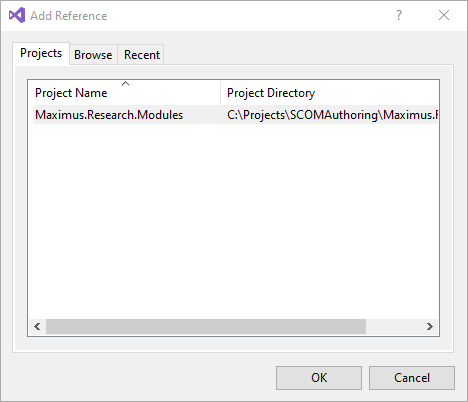
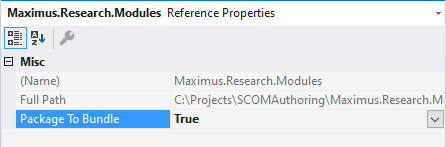
Now the class library should be added to the management pack project. Two things need to be done for this. First is to add the class library as reference to management pack and instruct VS to bundle dll file into mpb.
The second step is to describe the class library as deployable assembly (don’t confuse with assembly — this one is for Console UI extensions). This will require raw management pack XML editing, so let’s add an Empty Management Pack Fragment to the MP project. Then add Resources section and a DeployableAssembly. After editing, the Resource section should look like:
<ManagementPackFragment SchemaVersion="2.0" xmlns:xsd="http://www.w3.org/2001/XMLSchema">
  <Resources>
    <DeployableAssembly ID="Maximus.Research.ManagedModules.Modules.DeployableAssembly"
                        HasNullStream="false" Accessibility="Internal"
                        FileName="Maximus.Research.Modules.dll"
                        QualifiedName="Maximus.Research.Modules, Version=1.0.0.0, Culture=neutral, PublicKeyToken=fd5098a6a3259696" />
  </Resources>
</ManagementPackFragment>
NB! Management Pack project and all their child project must be compiled as Release.
Variety of tools can be used to get assembly qualified name, but I’d recommend to use JetBrians dotPeek (https://www.jetbrains.com/decompiler/). It’s an overkill for now, but extremely useful tool if you need to peek on other management modules by other vendors.
The current project is the minimum skeleton for any management pack with managed modules. These steps need to be repeated for all other project to enable management modules.
Finally it’s time to create the very first Probe Action module (which is the easiest one to implement). First, few references need to be added to the class library project. These are SCOM Agent SDK libraries: Microsoft.EnterpriseManagement.HealthService.dll, Microsoft.EnterpriseManagement.Modules.DataTypes.dll, and Microsoft.Mom.Modules.DataTypes.dll. These libraries are the minimum reference set for any agent-based workflow. You can find these libraries in any SCOM Agent or Server or Gateway installation. Just copy them to a development machine and reference in a project.
NB! Do not reference server-only libraries, or libraries, which require management server connection in agent-based workflows.
The code below is the bare minimum skeleton for a managed module probe action (condition detection and write action will be similar, but data source can be significantly different).
NB! This skeleton code missing acknowledge callback support, but if no SCOM monitor, rule, discovery, or task, in which this managed module used, require delivery confirmation, acknowledge callback support is not retired.
What this code does:
- In the constructor:
- Save the moduleHost value in the ModuleHost property (in the base constructor).
- Create a lock object to track module shutdown cycle. Note, that all methods might be called asynchronously.
- Load configuration if any. This example don’t have any configuration.
- Initialize any resources, the module needs. Alternatively, this initialization can be done in the Start() method.
- In the Shutdown() method, it sets an indicator for all other methods that module shutdown is in progress. Here you can free up any non managed resources like open files, SQL connections, etc. Just ensure that they are not used when the shutdown indicator is set. This method is not necessarily called on whole SCOM Agent shutdown. Other possibilities are management pack upgrade, target monitoring objects don’t exist any more, or monitor/rule/discovery is disabled, etc.
- In the Start() method, it checks if shutdown is not in progress, and then let SCOM Agent know, that the module is ready to receive inbound data items by calling ModuleHost.RequestNextDataItem(). It’s also possible to put resource initialization in this method.
- Finally, in the OnNewDataItems() method, our module receives inbound data items, do actual monitoring job, like reading last samples from DB table in this example, submit job results back to SCOM Agent, and let SCOM Agent know, that the module is ready for next inbound data item(s). This method also need to acknowledge inbound data item receive and notify on processing competition, if requested, but this part is omitted for simplicity, as it’s not used in this example.
This is very important to remember, that it’s managed module to open gates for SCOM Agent to send next inbound data item. It is a cycle of: receive inbound data item => process it => post results / drop results => let host know, that ready for next data item. Without the last step, SCOM Agent host will never send next item, and the whole monitor or rule, where managed module is used, will stop working. Say, there is a scheduler data source, which send a data item in a managed probe action every 60 seconds. This data item from the scheduler will never reach probe action’s OnNewDataItems() method, if the probe action hasn’t called ModuleHost.RequestNextDataItem() prior to a new data item is sent out.
Pay attention to the “[InputStream(0)]” method attribute. This is a way to let SCOM Agent know, which method to call when it has a new inbound data item to process.
[MonitoringModule(ModuleType.ReadAction)]
  [ModuleOutput(true)]
  public class SimpleProbeAction : ModuleBase<PropertyBagDataItem>
  {
    // tracking shutdown status
    private readonly object shutdownLock;
    private bool shutdown;

    public SimpleProbeAction(ModuleHost<PropertyBagDataItem> moduleHost,
      XmlReader configuration,
      byte[] previousState) : base(moduleHost)
    {
      // don't need to check moduleHost != null => the base constructor does this
      // check configuration != null only if the module has configuration
      shutdownLock = new object();
      // load configuration here if any
    }

    [InputStream(0)]
    public void OnNewDataItems(DataItemBase[] dataitems,
      bool logicallyGrouped,
      DataItemAcknowledgementCallback acknowledgeCallback,
      object acknowledgedState,
      DataItemProcessingCompleteCallback completionCallback,
      object completionState)
    {
      lock (shutdownLock)
      {
        // don't start if shutdown is in progress
        if (shutdown)
          return;
        PropertyBagDataItem[] ReturningResults = null;
        try
        {
          // put the actual monitoring code here: ReturningResults = <get result code>
        }
        catch (Exception e)
        {
          // log the error
        }
        if (ReturningResults != null && ReturningResults.Length != 0)
        {
          // send data back to SCOM Agent, if any
          if (ReturningResults.Length == 1)
            ModuleHost.PostOutputDataItem(ReturningResults[0]);
          else
            ModuleHost.PostOutputDataItems(ReturningResults, logicallyGrouped);
        }
        // completed the current run, ask for next
        ModuleHost.RequestNextDataItem();
      }
    }

    public override void Shutdown()
    {
      lock (shutdownLock)
        shutdown = true;
    }

    public override void Start()
    {
      lock (shutdownLock)
      {
        if (shutdown)
          return;
        // Request the very first data item
        ModuleHost.RequestNextDataItem();
      }
    }
  }
As this is a research, and the goal is to investigate how SCOM Agent host call all these methods, the next step is to add some excessive logging. For simplicity and readability reasons, and because it’s not production code, logs will be just written in a fixed path file (never do this in production code, although). So, adding a number of extra lines to the managed module like the one below. In addition to this, if multiple instances of the class are created, they need an increasing instance ID, so it’s known how many live instances and then they are created. To make a unique instance ID, the class constructor creates a GUID, and then use it for logging.
File.AppendAllText(@"C:\Temp\SimpleProbeActionLog.txt", $"[{instanceId}]: Entering {nameof(Shutdown)}.");
Next step it to wrap the code into SCOM probe action definition. Add another Empty Management Pack Fragment to the MP project can add the following module type definition:
<ManagementPackFragment SchemaVersion="2.0" xmlns:xsd="http://www.w3.org/2001/XMLSchema">
  <TypeDefinitions>
    <ModuleTypes>
      <ProbeActionModuleType ID="Maximus.Research.ManagedModules.SimpleProbeAction.ProbeAction" Accessibility="Public">
        <Configuration />
        <OverrideableParameters />
        <ModuleImplementation>
          <Managed>
            <Assembly>Maximus.Research.ManagedModules.Modules.DeployableAssembly</Assembly>
            <Type>Maximus.Research.Modules.SimpleProbeAction</Type>
          </Managed>
        </ModuleImplementation>
        <OutputType>System!System.PropertyBagData</OutputType>
        <InputType>System!System.BaseData</InputType>
      </ProbeActionModuleType>
    </ModuleTypes>
  </TypeDefinitions>
</ManagementPackFragment>
Probe action module type ID is just a unique string, but it’s recommended to start it with MP ID prefix. See Microsoft recommendations for details: https://docs.microsoft.com/en-us/previous-versions/system-center/developer/jj130347(v=msdn.10). Assembly field is deployable assembly ID from previous step. Type is the managed module class type full name, i.e. namespace + class name. Finally, module input data item type is System.BaseData, which is the root base type for all data item types, and System.PropertyBagData is SCOM data item type name for PropertyBagDataItem, which is declared as output type for the managed module.
However, probe action on its own will not being executed by SCOM Agent host. It needs to be a part of a valid and enabled monitor, rule, discovery, or task. Therefore, to make this managed probe action to run, we will create a monitor, a rule, and a task. But rule template required a data source, monitor template require monitor type, and only agent task template is OK to use probe action directly. That means, that more wrapping is required. First is to make a composition data source combining scheduler data source and our probe action. Next to make monitor type using this data source and fake condition detection (remember, the managed module never return any results).
The composite data source module type below combines the standard “System.SimpleScheduler” data source and the “Maximus.Research.ManagedModules.SimpleProbeAction.ProbeAction” probe action, defined at the previous step to make the probe action runs on regular interval. For simplicity purposes, the new composite data source doesn’t have configuration, and the member scheduler data source configuration is hard-coded (and again, never do this in production code). So, the new data source declares two members: timer data source and probe action. Then it binds them together in an execution chain in the “Composition” section. SCOM Agent chains member modules starting from the innermost node, this is why the data source, which must be the first in the chain, is referenced in the most nested node.
<DataSourceModuleType ID="Maximus.Research.ManagedModules.SimpleProbeAction.DataSource" Accessibility="Public">
        <Configuration />
        <ModuleImplementation>
          <Composite>
            <MemberModules>
              <DataSource ID="DS_Scheduler" TypeID="System!System.SimpleScheduler">
                <IntervalSeconds>60</IntervalSeconds>
                <SyncTime />
              </DataSource>
              <ProbeAction ID="PA_SimpleProbeAction" TypeID="Maximus.Research.ManagedModules.SimpleProbeAction.ProbeAction" />
            </MemberModules>
            <Composition>
              <Node ID="PA_SimpleProbeAction">
                <Node ID="DS_Scheduler" />
              </Node>
            </Composition>
          </Composite>
        </ModuleImplementation>
        <OutputType>System!System.PropertyBagData</OutputType>
      </DataSourceModuleType>
Next “wrap” is unit monitor type. It’s a bit more complex, and at the moment not a subject of this article, so I skip most of explanations about it. In general, the unit monitor type definition below prescripts SCOM Agent to get a property bag from the member data source, then apply two condition detections in parallel. Condition detection modules evaluate inbound data item against their configured conditions and either pass data item through, or drop it. Regular detection section says, that if the condition detection labeled “CD_OK” passes data item through, then set monitor state to “OK”, or if the condition detection labeled “CD_ERROR” do the same, then set stage to “ERROR”. (if the both detections pass the data item, then result is undetermined)
<UnitMonitorType ID="Maximus.Research.ManagedModules.SimpleProbeAction.UnitMonitorType" Accessibility="Public">
        <MonitorTypeStates>
          <MonitorTypeState ID="OK" NoDetection="false"/>
          <MonitorTypeState ID="ERROR" NoDetection="false"/>
        </MonitorTypeStates>
        <Configuration />
        <OverrideableParameters />
        <MonitorImplementation>
          <MemberModules>
            <DataSource ID="DS_SimpleProbeAction" TypeID="Maximus.Research.ManagedModules.SimpleProbeAction.DataSource" />
            <ConditionDetection ID="CD_OK" TypeID="System!System.ExpressionFilter">
              <Expression>
                <SimpleExpression>
                  <ValueExpression>
                    <XPathQuery Type="String">Property[@Name='Status']</XPathQuery>
                  </ValueExpression>
                  <Operator>Equal</Operator>
                  <ValueExpression>
                    <Value Type="String">OK</Value>
                  </ValueExpression>
                </SimpleExpression>
              </Expression>
            </ConditionDetection>
            <ConditionDetection ID="CD_ERROR" TypeID="System!System.ExpressionFilter">
              <Expression>
                <SimpleExpression>
                  <ValueExpression>
                    <XPathQuery Type="String">Property[@Name='Status']</XPathQuery>
                  </ValueExpression>
                  <Operator>Equal</Operator>
                  <ValueExpression>
                    <Value Type="String">ERROR</Value>
                  </ValueExpression>
                </SimpleExpression>
              </Expression>
            </ConditionDetection>
          </MemberModules>
          <RegularDetections>
            <RegularDetection MonitorTypeStateID="OK">
              <Node ID="CD_OK">
                <Node ID="DS_SimpleProbeAction" />
              </Node>
            </RegularDetection>
            <RegularDetection MonitorTypeStateID="ERROR">
              <Node ID="CD_ERROR">
                <Node ID="DS_SimpleProbeAction" />
              </Node>
            </RegularDetection>
          </RegularDetections>
        </MonitorImplementation>
      </UnitMonitorType>
The last step to start life cycle research is to create new templates for a new rule, monitor, and task. Add a new item to the MP project, and select Templates => Rule (Custom). Then add two other templates to the same file.

Then it’s time to configure the templates. ID, Target, Description, and Display Name should be configured for all the templates. Agent Task also need Probe Action Type ID to be configured. Probe Action Configuration also should be configured in general, but it’s empty in this example.

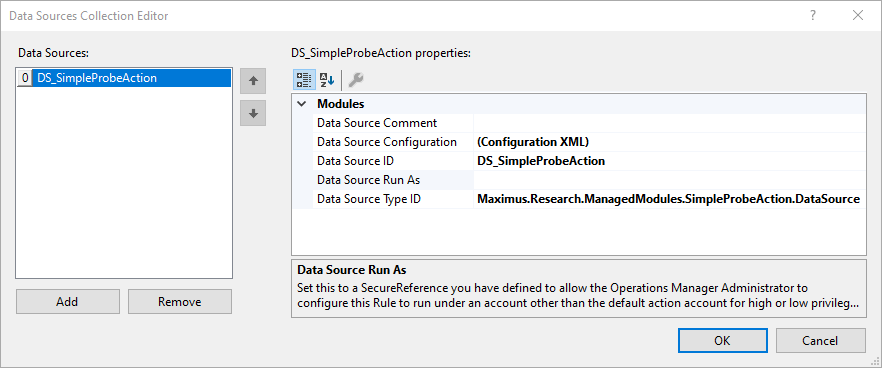
For the rule template, it’s only required to configure data source, which is configured in a separate windows. However, write action is compulsory for a rule, therefore it’s to be configured with empty command executor write action (it will execute and close cmd.exe).

The command executer write action has configuration, so it’s required to click on the configuration XML button and put the following XML:
<?xml version="1.0" encoding="utf-8"?>
<Configuration xmlns:xsi="http://www.w3.org/2001/XMLSchema-instance" xmlns:xsd="http://www.w3.org/2001/XMLSchema">
  <ApplicationName>cmd.exe</ApplicationName>
  <WorkingDirectory />
  <CommandLine>/C</CommandLine>
  <TimeoutSeconds>10</TimeoutSeconds>
  <RequireOutput>false</RequireOutput>
</Configuration>
Monitor configuration is the most complex. It requires referencing the previously created unit monitor type, its configuration (empty), and mapping between health state and monitor state (which was defined as OK and ERROR). Also, alerts settings are to configured.


Target parameter is set to “Microsoft.Windows.Computer” for all three test items. That means, that SCOM Agents will execute by an instance of the rule/monitor for each instance of the “Microsoft.Windows.Computer” class. In other words, the rule and monitor will run at all monitored Windows computers (therefore, they all must have “C:\Temp” folder created to avoid exceptions). Task is executed manually on a selected set of class instances, i.e. on selected computers.
And finally, it’s time to build the solution, deploy, and investigate results! So, after deploying the management pack, the results are below. I’ll continue with result analysis and more complex scenarios in next part.
[60900b93-f1de-4b2d-b9f6-ea88e064eae1]:[17:19:27]: SimpleProbeAction class instance is created. Host process PID: 2020; Managed thread: 5
[60900b93-f1de-4b2d-b9f6-ea88e064eae1]:[17:19:29]: Entering Start; Managed thread: 8.
[60900b93-f1de-4b2d-b9f6-ea88e064eae1]:[17:19:29]: First data item requested.
[60900b93-f1de-4b2d-b9f6-ea88e064eae1]:[17:19:34]: Entering OnNewDataItems; Managed thread: 15
[60900b93-f1de-4b2d-b9f6-ea88e064eae1]:[17:19:34]: Received 1 inbound data items of System.TriggerData type.
[60900b93-f1de-4b2d-b9f6-ea88e064eae1]:[17:19:34]: No shutdown in progress.
[60900b93-f1de-4b2d-b9f6-ea88e064eae1]:[17:19:34]: Competed output data item.
[60900b93-f1de-4b2d-b9f6-ea88e064eae1]:[17:19:34]: Next data item requested.
[60900b93-f1de-4b2d-b9f6-ea88e064eae1]:[17:20:34]: Entering OnNewDataItems; Managed thread: 10
[60900b93-f1de-4b2d-b9f6-ea88e064eae1]:[17:20:34]: Received 1 inbound data items of System.TriggerData type.
[60900b93-f1de-4b2d-b9f6-ea88e064eae1]:[17:20:34]: No shutdown in progress.
[60900b93-f1de-4b2d-b9f6-ea88e064eae1]:[17:20:34]: Competed output data item.
[60900b93-f1de-4b2d-b9f6-ea88e064eae1]:[17:20:34]: Next data item requested.
Second part: https://maxcoreblog.com/2020/08/05/implementing-scom-managed-modules-part-2/
Last part: https://maxcoreblog.com/2020/11/03/implementing-scom-managed-modules-part-3/

2 thoughts on “Implementing SCOM Managed Modules. Part 1.”