This management pack monitors availability of remote network resources using variety of methods, like ping, TCP connect, HTTP probe, SSL/TLS connect, etc. But it is also build with a unique approach to easy management pack configuration. This is why, it has an intuitive UI (User Interface) built into SCOM Console application to edit remote destinations, associated tests and test settings. Another unique feature of this MP is extendibility. Other MP authors may follow a simple example and add their own connectivity probes to be seen and configurable via the UI.
Note: The management pack hasn’t being widely tested, so please forgive some bugs, but don’t hesitate to report them, please.
User Manual: this article.
How to add more tests: https://github.com/MaxxVolk/Maximus.Connectivity.ExampleExtension.Monitoring
Making Of: https://maxcoreblog.com/2021/01/11/connectivity-monitoring-scom-management-pack-the-making-of/
Download at: https://github.com/MaxxVolk/Maximus.Connectivity.Monitoring
Guide.
This guide is based on the version 1.0.0.199 of the management pack. For updated versions, new releases, and source code, please visit https://github.com/MaxxVolk/Maximus.Connectivity.Monitoring.
Supported Configuration
The management pack is designed for System Center Operations Manager (SCOM) 2016 and higher versions.
Management Pack Scope
This management pack is aimed to verify connectivity to various destination types either on local network, or on the Internet. This management pack (MP) is a base MP, which contains basic connectivity tests and a SCOM Console application extension for visual configuration (UI). The UI allows to define testing destinations, choose which SCOM agents or Resource pools run tests, and define which tests should be running against each destination.
Installation
To install this MP you need a SCOM 2016+ deployment. First, you need to download and install Maximus Base Library at https://github.com/MaxxVolk/Maximus.Base.Library. The Base Library MP contains class libraries for UI components and managed actions used in the Connectivity Monitoring MP. After installing the Base Library MP, download and install the Connectivity MP form https://github.com/MaxxVolk/Maximus.Connectivity.Monitoring.
Create a new issue at GitHub if installation is not successfull.
Configuration
After the Connectivity Monitoring MP is installed, a new folder appears in SCOM Console, see #1 at the screenshot below. Other areas will be explained below.
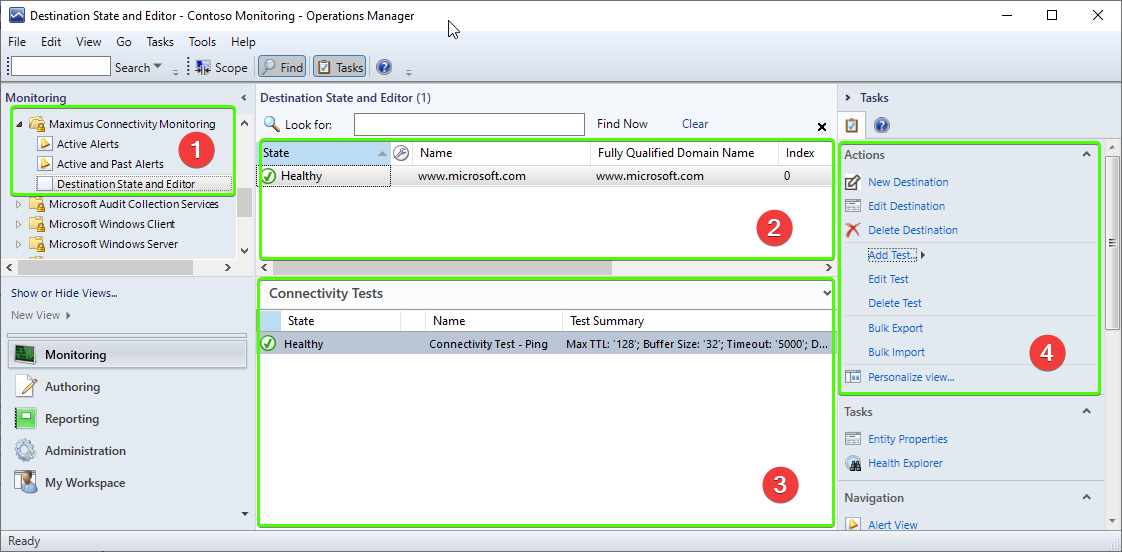
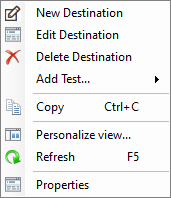
To start monitoring a destination, you need to add it first. In the Monitoring section if the SCOM Console, find the ‘Maximus Connectivity Monitoring’ folder and expand it. Select the ‘Destination State and Editor’ node. All operations with destinations and test objects (see below) are performed using Action Tasks Pane (Fig1, #4) or using context menu shown on mouse right-click. Refer to Fig 2 for context menu appearence.
To add a new destination click ‘New Destination’ in the Task Pane or in the context menu. The New/Edit Destination dialog will appear (Fig 3).
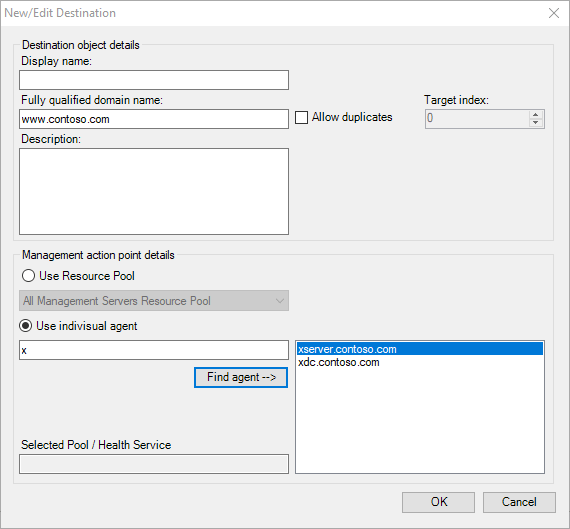
For each destination first, you define a fully qualified domain name (FQDN). This is the main destination property. FQDN will define a destination host for all tests. FQDN also can be reduced to simple host name if a source node has default DNS suffix or an explicit DNS suffixes list. Alternatively, an IP address also can be used instead of FQDN. Display name is used for display only and appears on alert messages. If it’s left empty, FQDN value will be used. Description property is for reference only, for example “Production web site” or “Test SQL server”, etc. With default dialog settings, you can create only one destination object for any FQDN. I.e. if you have already created a destination using server.domain.com FQDN, then the dialog won’t let to create another destination using the same server.domain.com FQDN. If you wish to override this behavior, check the ‘Allow duplicates’ option and either select a unique index (any integer number), or let the system find the first available index automatically.
After defining Display Name, FQDN, and description property, you need to select future tests’ source. A source is either an individual SCOM Agent or a Resource Pool (i.e. a group of Gateway or Management Servers). Source will actually run all defined test. From network connectivity perspective, the source is a node, which initiates a connection to the destination. If you wish to use an individual SCOM Agent (i.e. any agent-monitored Windows Computer), select the ‘Use individual agent’ radio button, type part of the selected agent name, than click the ‘Find agent’ button. All available agents will be displayed at the right. Select the agent you wish to use. If you would like to leverage high availability with Resource Pools, then select the ‘Use Resource Pool’ and then select one of available pools from the drop down list. To define new pools and to read more about pools, refer to Microsoft documentation at https://docs.microsoft.com/en-us/system-center/scom/manage-resource-pools-manage?view=sc-om-2019.
After defining destination and source, click the OK button to same it.
To edit a destination, select it in the status area (Fig 1. #2) and click ‘Edit Destination’ in the Task Pane (Fig 1. #4) or in the context menu (Fig 2). Please note, that FQDN and index (for duplicate FQDNs) propertied cannot be edited. Only display name, description, and source can be changed after a destination is created.
Important note! When defining/changing source (i.e. agent or pool), the UI submits a recommendation for SCOM to use that agent or pool. That doesn’t guaranty, that SCOM engine will actually use this agent pool. It also takes up to 5 minutes to process the recommendation and select a real source (in 99.9999% SCOM will follow the recommendation). Bear in mind, that the New/Edit Destination dialog shows the real source when edit an existing destination. For just created destination, that means, that the dialog won’t show any real source, if you try to edit destination right after creating it. This is because SCOM engine has not processed the recommendation yet. For destination, where source has been recently changes, the dialog will detect difference between saved recommendation and real source, and will show a warning as well as lock controls, so new recommendation cannot be issued until the current one is processed.
To delete a destination, select it and simply click ‘Delete Destination’ in Task Pane (Fig 1. #4) or in the context menu (Fig 2). You can delete multiple destination at once. If any tests have been added to a destination, they will be deleted too.
After defining a destination, you can start adding test objects to run different types of connectivity tests. Each test object is associated with certain set of monitors and/or performance collection rules described in to either this document below, or, if the test objects defined in extension management packs, in respective management pack documentation. Note, that extension MPs can also add additional monitors/rules to already defined test object types. For example, adding ‘Ping’ test object will add the ‘ICMP availability (Ping)’ and ‘Ping Slow Response’ monitors, and the ‘Ping Round Trip Time Collection’ rule. At the same time, the test object itself has all setting required to perform ping test, i.e. timeout, buffer size, allow/disable fragmentation, etc. To add a new test, select a destination, to which you wish to add a new test, then click ‘Add test…’ in the Task Pane (Fig 1. #4) or in the context menu (Fig 2). The submenu will show all available test objects. Number of available test object can be increased by installing new extension management packs, or in future versions of the base MP. Current list of the test object is shown at Fig 4 below.

The new test sub-menu shows test name and test originating MP in brackets. To create a new test, simply select it from the menu. Note, that any number of test objects can be created including full duplicates. For example, you can define multiple Ping tests with different buffer size. When test type is selected, a New/Edit Test dialog will appear. See Fig 5 below.

This dialog shows generic test object description (Fig 5, #1), grouped list of test objects properties available to edit (Fig 5, #1), and currently selected property description (Fig 5, #3). Note, that descriptions might be unavailable for test objects from 3rd party management packs. Common Monitoring settings defines how often SCOM will run monitoring probes, how many failed probes required to raise an alert, and where is to collect performance data. However, bear in mind that particular probe/monitoring implementation may ignore some or all of these properties. Display Name property in Generic category is for display purposes only, and Template Reference form Template Settings is not supported in the current release. Finally, the Test Specific Settings category contains property related the current test type. After editing required properties, click OK and a new test object will be created. After this, SCOM engine will start any monitors and rules associated with the current test object. Any test objects associated with a selected destination are shown in the Connectivity Tests details area (Fig1, #3).
Similarly you can edit or delete any existing test objects by selecting them and clicking ‘Edit Test’ and ‘Delete Test’ in Task Pane (Fig 1. #4) or in individual context menu by right-clicking in the test list area (Fig1, #3). Multiple test objects can be deleted at once. Note, that unlike destination, all test object properties are editable.
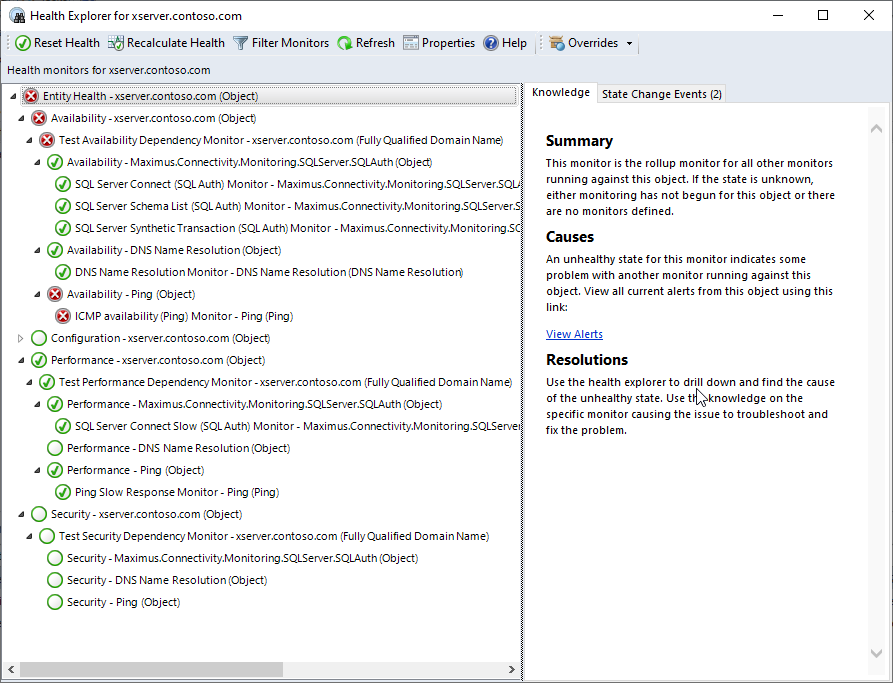
When test objects are created and initialized, you can use Health Explorer to brows health model for a selected destination. Refer to Fig. 6.
To view current or current and past connectivity alerts, use the ‘Active Alerts’ and ‘Active and Past Alerts’ views retrospectively (Fig. 1, #1).
Test object types available in the current release.
The current release has four test objects: Ping, DNS Resolution, SSL, TCP Connect, and HTTP Probe.
Ping Test Object
All ping monitors take respect of alert suppression settings. ‘Collect Performance Data’ option is supported and turns on and off the ‘Ping Round Trip Time Performance Collection Rule’. Associated monitors and rules:
| Name | Alert Name | Threshold(s) |
| ICMP availability (Ping) Monitor | Destination Unreachable | No explicit configuration in the monitor, but Timeout property of the test object defines when ping is not successful. |
| Ping Slow Response Monitor | ICMP Echo Response (Ping) Slow | WarningResponseTime = 1500 ms |
| Ping Round Trip Time Performance Collection Rule | N/A | N/A |
DNS Resolution
DNS Resolution monitor takes respect of alert suppression settings. ‘Collect Performance Data’ option is not supported. Associated monitors and rules:
| Name | Alert Name | Threshold(s) |
| DNS Name Resolution Monitor | DNS Name Resolution Failed | No. |
SSL Connection
SSL Connection monitors do not take respect of alert suppression settings. ‘Collect Performance Data’ option is not supported. Associated monitors and rules:
| Name | Alert Name | Threshold(s) |
| Allowed SSL Protocol Monitor | No Allowed SSL Protocols Supported | No thresholds, but monitor’s alerting conditions defined by ‘Allowed SSL Protocols’ test object property. To success the monitor, remote server must implement at least one of the protocols listed in the property. |
| Certificate Expiration Monitor | Remote Server Certificate Expiring | DaysBeforeExpirationWarning = 15. Monitor will turn warning when DaysBeforeExpirationWarning left on certificate’s validity period, and then turns critical then the certificate expires. |
| Certificate Policy Monitor | Remote Server Certificate Policy Error | No. |
| Certificate Validity Monitor | Remote Server Certificate Not Valid | No thresholds, but almost all test object properties affect results from this monitor. |
| Disabled SSL Protocols Monitor | Disabled SSL Protocol Detected | No, but the ‘Disabled SSL Protocols’ defines which protocols remote server must not implement. |
HTTP Probe
HTTP Probe monitor takes respect of alert suppression settings. ‘Collect Performance Data’ option is supported. Associated monitors and rules:
| Name | Alert Name | Threshold(s) |
| HTTP Probe Monitor | HTTP Request Failed | No. Apart of request configuration properties (like header values, authentication settings, request method, and body), the monitor will analyze returned response using the ‘Regular Expression’ and ‘Expression Not Match’ test object properties and turns into warning state if analysis failed. |
| HTTP Request Response Time Performance Collection Rule | N/A | N/A |
TCP Connect
TCP Connect monitor takes respect of alert suppression settings. ‘Collect Performance Data’ option is supported. Associated monitors and rules:
| Name | Alert Name | Threshold(s) |
|---|---|---|
| TCP Connect Monitor | TCP Connection Failed | No. But the test object defines an optional send and/or receive operations and the ‘Response Regular Expression’ property to validate response (if expected). |
| TCP Probe Time Taken Performance Collection Rule | N/A | N/A |
Copyright
This management pack is an open-source project available under MIT license. The license agreement is available at https://github.com/MaxxVolk/Maximus.Connectivity.Monitoring/blob/master/LICENSE.
This document is provided “as-is”. Information and views expressed in this document, including URL and other Internet website references, may change without notice. You bear the risk of using it.
Some examples depicted herein are provided for illustration only and are fictitious. No real association or connection is intended or should be inferred. This document does not provide you with any legal rights to any intellectual property in any Microsoft product. You may copy and use this document for your internal, reference purposes. You may modify this document for your internal, reference purposes.
(C) 2021, Maxim Volkov.

Hi Max, This is a very good monitoring solution. Is there a packaged .mpb\*.mp file available for download?
LikeLike
sure, the latest (at the time of this comment) release is published at https://github.com/MaxxVolk/Maximus.Connectivity.Monitoring/releases/tag/1.0.0.237. You’ll also need the base library, which can be downloaded at https://github.com/MaxxVolk/Maximus.Base.Library/releases/tag/v1.0.1.5.
LikeLike
Thx Max.!
LikeLike
Hi Max, Do we have a option to track performance data(SCOM Rules) or is it just configured for Alerting?
LikeLike
Found the option. Thx
LikeLiked by 1 person
Hi Max,
Thanks for all the effort you have put in the connectivity monitoring.
We are currently using primarily the TCP monitor on different servers however we are having this error message on some of the servers where the state does not change from ‘not monitored’
We have not been able to identify why it works on some servers and not other as everything is setup the same.
Error:
Exception in TCPConnectPA.
Message: Internal module exception or error.
Message: Failed to get module’s output data in GetOutputData of Maximus.Connectivity.Modules.TCPConnectPA
Error Severity: DataLoss
Error Criticality: ThrowAndContinue
Exceptions:
1): Exception type: Maximus.Library.ManagedModuleBase.ModuleBaseException
Maximus.Library.ManagedModuleBase.ModuleBaseException exception (Failed to get module’s output data in GetOutputData of Maximus.Connectivity.Modules.TCPConnectPA)
2): Exception type: System.IO.FileNotFoundException
System.IO.FileNotFoundException exception (Could not load file or assembly ‘Microsoft.EnterpriseManagement.Core, Version=7.0.5000.0, Culture=neutral, PublicKeyToken=31bf3856ad364e35’ or one of its dependencies. The system cannot find the file specified.) at Maximus.Connectivity.Modules.TCPConnectPA.GetOutputData(DataItemBase[] inputDataItems)
at Maximus.Library.ManagedModuleBase.ModuleBaseSimpleAction`1.OnNewDataItems(DataItemBase[] dataItems, Boolean logicallyGrouped, DataItemAcknowledgementCallback acknowledgeCallback, Object acknowledgedState, DataItemProcessingCompleteCallback completionCallback, Object completionState)
Current Process Id (PID): 13060
Module: Maximus.Connectivity.Modules.TCPConnectPA
Version: 1.0.0.21 : %2
Do you have any idea what this could be?
Much appreciated.
Igor
LikeLike